FY2027 Budget Adopted, MassCore Completion Rates Questioned, and School Choice Discussion Revisited | Last Night at School Committee: March 25, 2026
Last Night at School Committee - March 25, 2026
Last night was the first full meeting in a month after a series of budget hearings. The meeting covered three topics; vote on the 2026-2027 budget, update on MassCore and the annual discussion on school choice. We dig into each of these areas below and on the podcast. We are also excited to unveil a new tool to help you better understand the BPS budget.
The FY 27 Budget Vote
We have spent a lot of time covering Boston Public School’s budgetary challenges. With the adoption of a $1.71B budget, a 4.5% increase from last year after already running a deficit this year, it is more important than ever to understand where this money goes. We are proud to introduce our FY2027 BPS School Budget Viewer, an interactive tool that combines years of complicated data and presents it in an easy-to-understand format for public use. Click the link above, or go to the Last Night at School Committee Page on the Shah Foundation site to access it.
The tool has multiple dashboards that lets students, teachers, policymakers, and concerned citizens understand how the budget is changing in 2027 and how we got there. School Database allows you to explore enrollment, budget, and staffing changes for individual schools from 2026 to 2027. The dashboard shows district-wide changes, and searching for or clicking on individual schools in the list will bring up school-specific data. Budget Breakdown details how the FY2027 budget is spread between direct school funding and central office funding, and how each broad category and specific line item is changing. Hovering over each box provides more information, and filters on the right allow for a closer view. Budget Over Time will detail how each broad budget category has changed since 2019, and which portions of the budget have grown the fastest.
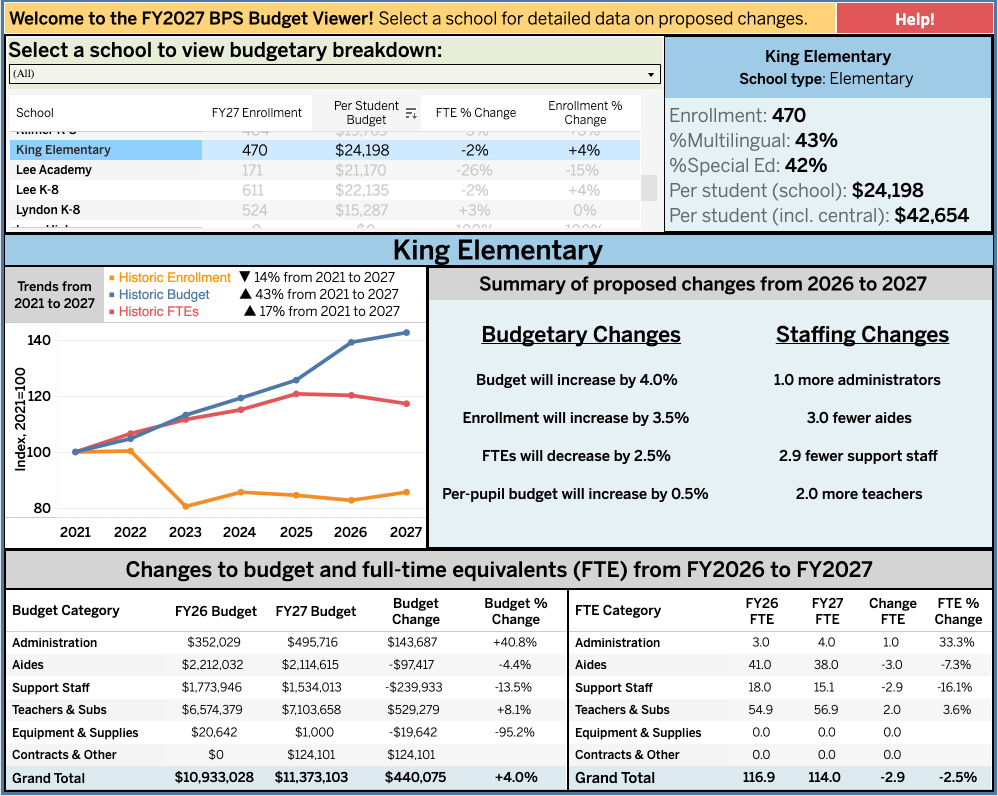
The tool allows you to explore school-level changes and easily see the individual changes coming in the next year. In the screenshot above, we can see that King Elementary is predicted to see a 3.5% increase in enrollment over the next year, and a corresponding 4% increase in budget. However, it will see a decrease in staffing, including the elimination of 6 aides and support staff alongside 2 more teachers and 1 more administrator. The chart on the left of the interface shows how the school has changed over time. In this case, King Elementary has seen a 14% reduction in enrollment since 2021 – but a greater than 40% increase in total budget.
But school budgets are only half of the BPS budget, and centrally budgeted functions make up over 50% of the $1.71B total. Looking at those charts allows us to see the serious structural problems leading to BPS’s budgetary woes. We have covered the central budget, and specifically transportation (which will cost $45 per student transported per day) in the past. But this tool allows us to put into perspective how much transportation and ‘business services’ (largely employee benefits) alone cost the district. It’s important to understand the budget crunch does not come from one line item or one unexpected expense. It is true that health insurance costs were higher than expected this year. But this is largely a function of hiring more staff than the district could handle, a choice entirely within BPS’s control. The painful 400+ FTE reduction this year is large, but BPS will still have 10,469 staff, more than it did in 2023, even though enrollment is far lower. Transportation had an ‘unexpected’ cost increase, but it’s grown by 68% since 2019, even with far fewer students transported. These are not surprise costs, they are the result of specific choices and years unaddressed rising costs. The district promised in its 2022 Long Term Facilities Plan (now reaching the end of its proposed changes) that there would be significant cost savings from right-sizing the district. In 2021, there were 121 buildings and the district spent $53/m on facilities management. In 2026, there were 109 buildings and the district spent $68M on facilities management, not counting the 120% increase in planning and engineering costs since then. Promised cost savings have not been delivered.
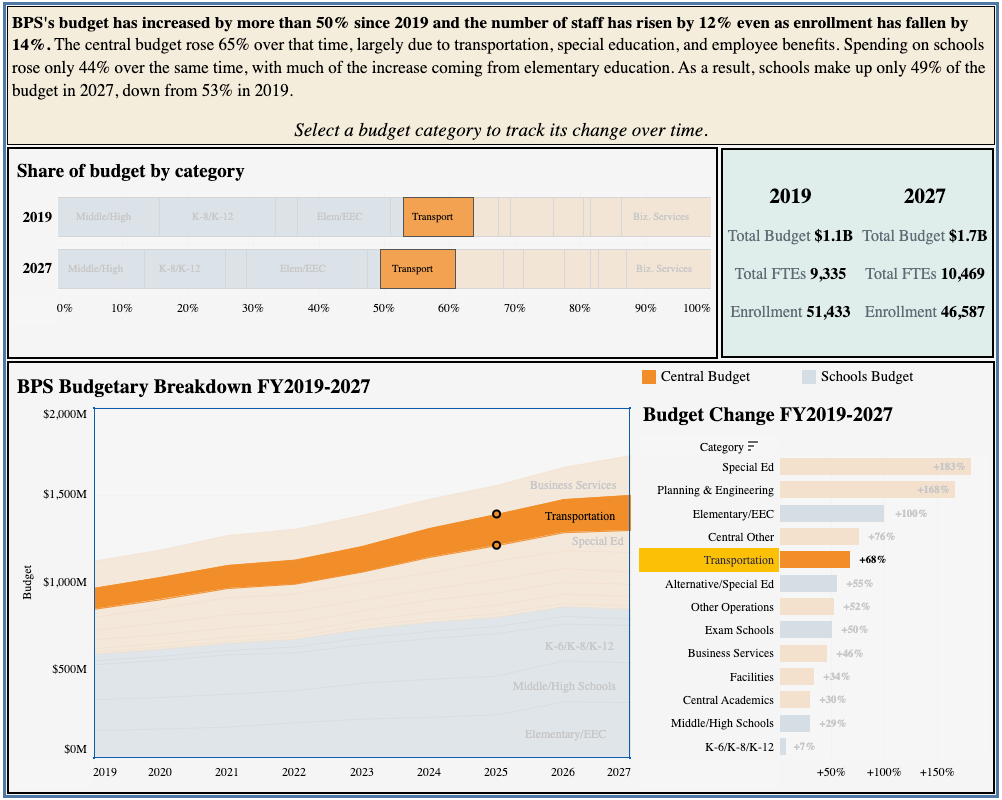
In 2027, BPS will spend over $36,820 per student, up from $20,373 in 2019. Across the board, BPS spends more to educate fewer students every year. While some of these increases are certainly worthwhile, the current trajectory is not sustainable. There is no ‘silver bullet’ to bring costs down, and no single outsized cost or program is to blame. A deep, honest, look at how and why BPS spends what it does is critical for the continued function and success of the district and its students. We hope that this budget tool can help contribute to this necessary conversation.
MassCore: What Does Progress Mean?
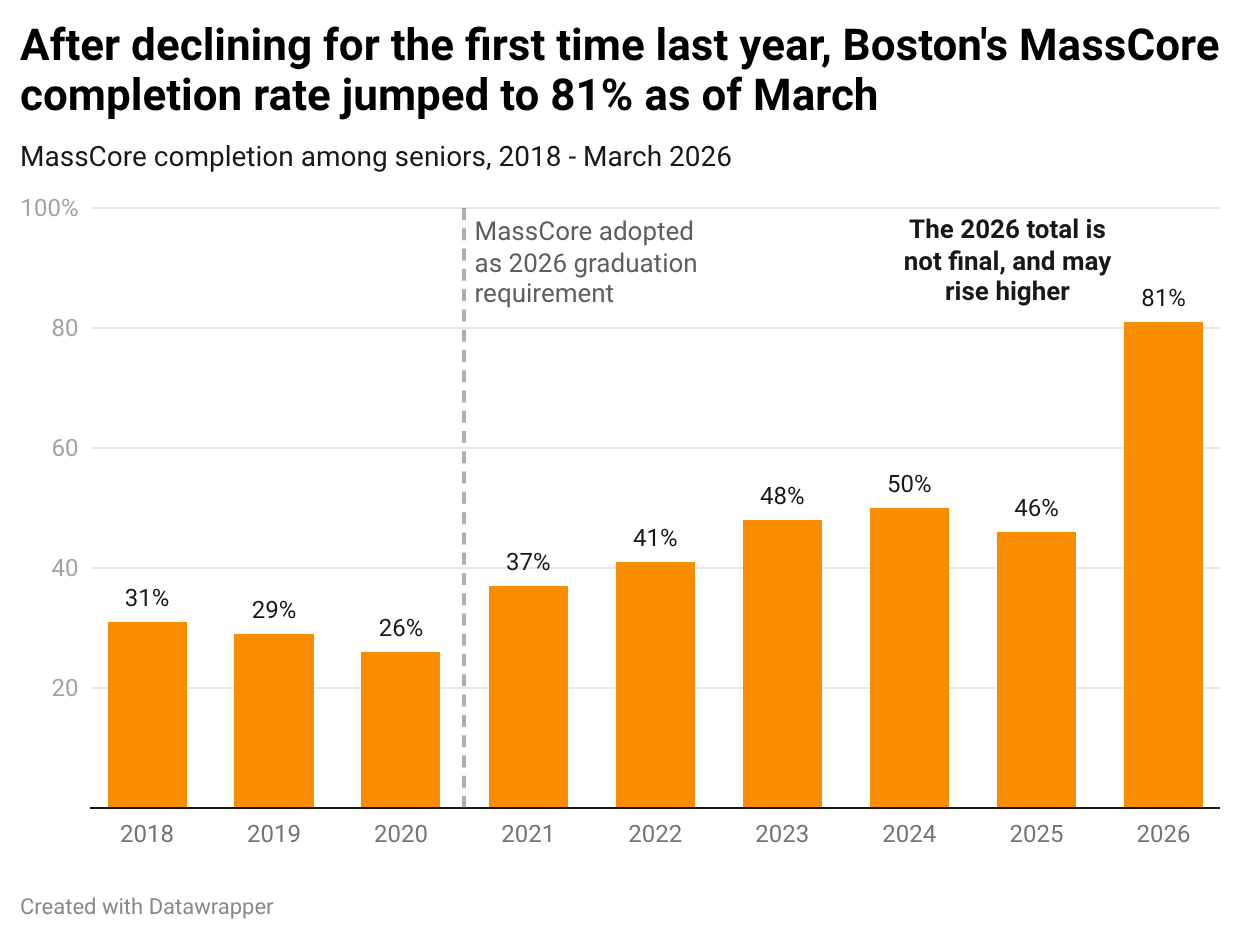
One of the meeting’s most revealing discussions came during the update on MassCore graduation requirements. District leadership reported that 81% of the Class of 2026 is now on track to meet MassCore requirements which represents a dramatic increase in a relatively short period of time. This improvement was attributed to ongoing support, credit recovery, and expanded pathways. But the speed of that progress raised questions. If the district struggled for years to move this number, how did it suddenly improve so quickly? Vice Chair Skerritt introduced another layer to the conversation: MassCore compliance is, to some extent, self-reported. Districts determine how courses align to requirements, meaning that similar outcomes across districts may not reflect the same level of rigor.
As we have covered previously, Boston has struggled to have its seniors meet the MassCore standard. In 2021, the district adopted it as a future graduation standard for the class of 2026. At the time, just 31% of seniors fulfilled the MassCore requirements. As of 2025, only 46% of students completed MassCore. After years of minimal progress, it was thus when BPS announced last night that 81% of seniors have now completed MassCore. This near doubling of MassCore completion taking place seemingly overnight is hard to square with the district’s previously languid pace. This chart shows the stunning reversal and 35% year-over-year increase that followed a decline from 2024 to 2025.
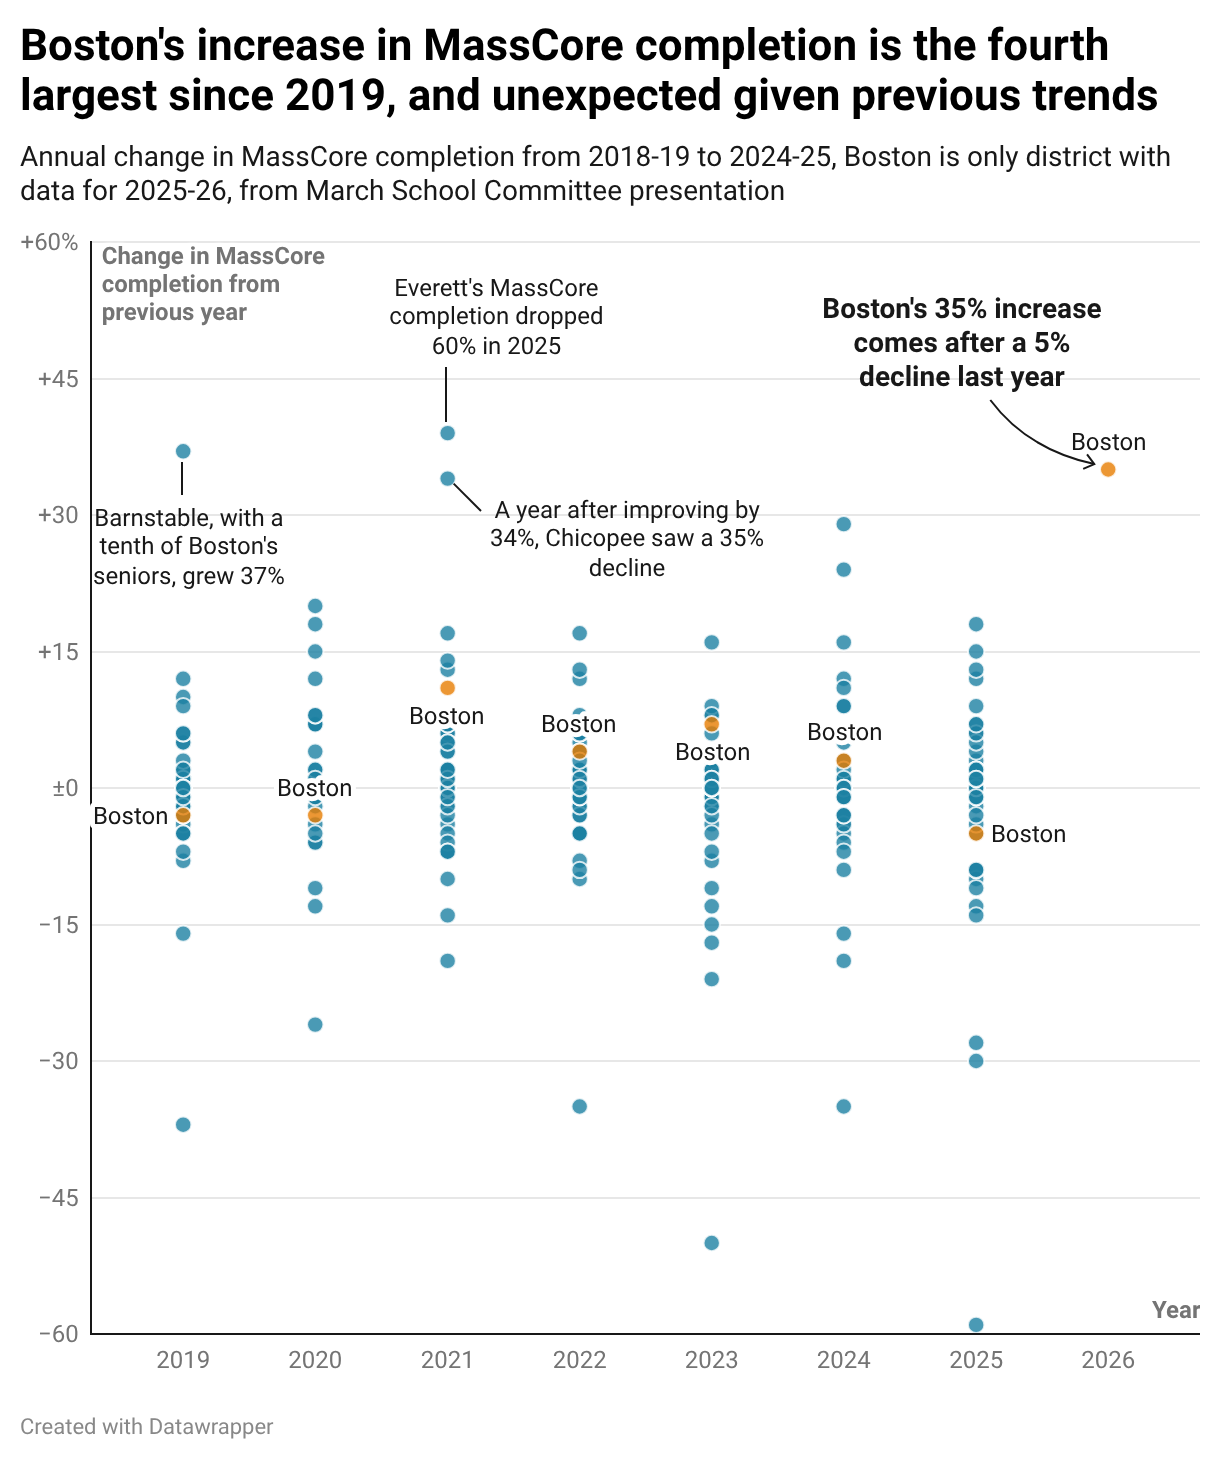
Since adopting MassCore as a standard, the district averaged just 2% growth, far slower than most other large districts. The next chart details the yearly change in MassCore completion for more than 60 large public school districts in Massachusetts since the standard was overhauled in 2018. If it holds, Boston’s annual increase would be the fourth largest ever, and one of just a handful of extreme outliers. Districts with similar single-year overperformances have not all succeeded. The largest increase came from Everett, which saw a 39% increase from 2020 to 2021. While it retained 100% completion for years after, the district saw completion plummet to 41% in the last year, the largest drop on record. Chicopee increased by 34% one year, only to decline by 35% in the next. Barnstable, with just 350 seniors, was the only district with such a large increase to retain its improvements.
This increase raises many questions. If the district could rapidly bring students up to the MassCore standard, why did they not do so in the years following the 2021 vote? If the district truly believes that completing the MassCore curriculum best equips students to succeed, then what does that say about the students who graduated without it? If the district was unable to get students up to the standard until the last six months, what changed? Expansion of Early College and Vocational Pathways and separate credit requirements for alternative schools are too limited to have such a large impact on district-wide completion rates. The single biggest challenge that the district identified with increasing MassCore completion was the 6 period bell schedule. While they adopted changes to move to a 7 period schedule, those only made possible by changes to collective bargaining agreements and do not take effect until the next school year. If they have managed to achieve 80% completion without those schedule changes, were they necessary?
Two possible explanations lie with ‘Student Circumstances’ and ‘Credit Recovery’. The former largely deals with students who transfer into the district and how their previous educational experience is counted towards BPS credit completion. The district wide latitude in determining how previous credits count and acceptable alternatives without formally filing a waiver. The latter is a program that lets students take online courses for credits they have failed or otherwise missed. School leaders have cited credit recovery programs as a key tool to help graduate students. In 2012, the district identified nearly 400 students who would have otherwise been ineligible for graduation using credit recovery to graduate, helping to increase the district-wide graduation rate by 4.8%.
School Choice: Is a Pilot Worth It?
The final major topic of the evening was the Massachusetts Interdistrict School Choice Program, which requires districts to either opt in or formally withdraw each year. Despite ongoing enrollment declines, BPS has lost roughly 10,000 students over the past decade, the conversation around school choice was relatively subdued. This is despite the fact that over the past three years, committee members have hypothesized about potential pilots that the district could try to increase the student body across the district. District representatives noted that members of their team were looking at potential options and consulting with the legal department to understand what would be compliant. Nevertheless, no major shift in strategy occurred last evening, and it seems like the district will opt-out once again.
What’s Next?
The next Boston School Committee meeting will be held on April 15th at 6:00pm. Stay tuned for more from the Shah Foundation team in the meantime! Be well, and go Sox!